The growth of South Africa’s betting markets has been undeniable and it doesn’t feel like it will stop anytime soon. And at this pace, it is getting difficult to keep track of the South African betting sites that exist today—that is how immersive the growth has been. On the other hand, we have done our homework to keep track of some records for the market in previous years. We tailored this overview to give you an insight so you can have these facts and figures for yourself, so read on and enjoy!
Before we jump into it, we must also tell you that most of our stats will be between 2013 and 2016 because these are the proven and confirmed ones. Without further ado, let’s get into it.
Gross Gaming Revenue (GGR) In South Africa
The GGR of South Africa has been on a steady rise as long as the record covers it. It has been on continuous growth since 2012 as records have it. In 2012, the total GGR peaked at R20 854 million, and when the board estimated it to be a new high, it was only a beginning.
2013 saw a 3.22% rise as it hit R21 526 million. We saw another increase to R23 339 million in 2014. 2015 marked the highest percentage growth the GGR has had in recent years; it rose by an unseen 11.23% to hit R25 962 million. Ironically, the succeeding year 2016 gave one of the lowest GGR percentage rises in recent years too, adding up to only R26 963 million.
For the subsequent years, South Africa had a total GGR of 28 165, 30 610, 31 890, 33 505, and 34 860 (R millions) for 2017, 2018, 2019, 2020, and 2021 respectively. Although the growth seems great, research shows that it should be more if not for some factors like economic conditions and illegal gambling ventures.
The combination of revenues lost from illegal land-based and online gambling equals billions of South African Rand in Gross Domestic Product (GDP). And as if the monetary loss wasn’t enough, reports show that over 3000 jobs were lost due to the illegal gambling businesses.
Comparison of Gross Gambling Revenues For Different Sectors In 2016 Vs 2021
Asides from the total GGR, how does it look for different sectors? For casino gambling, that of 2016 was R17 901 million which in 2021 peaked at R21 220 million, marking an 18.54% increase. Sports betting, on the other hand, rose from R5 086 million in 2016 to R7 520 million in 2021, making a 47.86% increase. Limited payout machines had a 43.86% increase from R2 697 million in 2016 to R3 880 million in 2021. Bingo had the highest GGR growth, adding up to 75.14% with a move from R1 279 to R2 240 million in 2016 to 2021 respectively.
Payout Rate For DIfferent Gambling Sectors

Different gambling sectors have varying payout rates and it is dependent on several factors. We will disclose the various payout percentages in betting, Limited Payout Machines (LPM), bingo, and casinos. Each of the percentages will be between the years 2012 to 2016 as those verified by the National Gambling Board of South Africa.
Betting
Ordinarily, one would expect that sports betting would have some of the highest payout rates by category but it isn’t exactly true. By percentages, the rate is high, but compared to other sectors, sports betting offers the lowest payout percentages per year (at least from 2013). So which category offers the highest? You will need to read on to find out. But as for betting, 2013 offered a recorded 88.4% while 2014 offered 88.3%. Unsurprisingly, 2015 had a lower percentage of 87.5% before rising to a better 88.8% in 2016.
Limited Payout Machines (LPMs)
Limited Payout Machines (LPMs) in South Africa are proven to have better payout rates than betting. As hard as it is to believe, the numbers prove it. 2013 provides a 91.4% payout rate which is better than the highest that betting had between 2013 to 2016. It increased progressively for LPMs as records show 91.5%, 91.9%, and 92% for 2014, 2015, and 2016 respectively.
Bingo
Nobody probably sees it coming but bingo offers the best payout rates in South Africa—as the record shows from previous years. 2013 was by far the lowest with a 91.6% payout rate. But 2014 gave a sharp increase to 94.4% while 2015 and 2016 followed with 94.5% and 93.9% respectively. Considering that the game doesn’t involve too many technicalities, it is understandable that it has had the best sets of payout rates over the years.
Casinos
Casinos also have a high percentage payout rate but only slightly behind bingo. 2013 had 93.4% while the next three years had 93.2%, 93.4%, and 93.4% respectively.
Gambling Taxes and Levies in South Africa

Since we have considered the respective Gross Gaming Revenue (GGR) and payout rates for different gambling sectors, it is only fair that we consider their taxes and levies too.
As a Share of GGR
First, we will outline gambling taxes and levies as a share of GGR for different sectors.
For Limited Payout Machines (LPMs)
Statistically, taxes and levies are the highest on LPMs compared to other sectors. 2013 records show a 12.3% annual percentage while 2014, 2015, and 2016 gave 12.6%, 12.8%, and 12.9% respectively. For a category that averagely offers over 90% payout annually, we see it as a decent estimation.
For Casinos
Casinos have a decent tax and levy rate annually as 2013 had 9.9%. 2014 had a peak of 10.3% while 2015 had a minor drop to 9.9%. We then saw a rise to 10.2%.
For Betting
Betting had a somewhat irregular tax and levy distribution annually and it is quite understandable as output depends on yearly sports activity. 2013 gave a relatively high percentage of 11.6% while gave a drop to 9.9%. 2015 and 2016 gave even lower percentages of 8.9 and 8.5% respectively.
Bingo
Bingo taxes and levies were at 7.2% as of 2013 while subsequent years gave a surprising rise to 11%, 10.9%, and 10.9% for 2014, 2015, and 2016 respectively. The increase is quite understandable as the game progressively increases in popularity and players over the years.
Taxes and Levies By Provinces

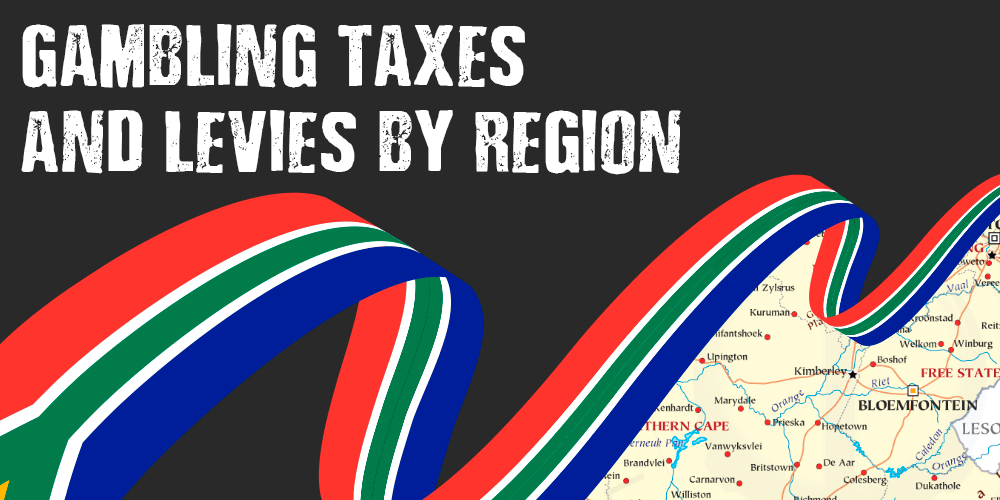
While taxes and levies may vary for different sectors, it is also dependent on region. Some areas may have higher taxes and it is dependent on factors like population, and several other things. We will consider the numbers for nine regions between 2012 and 2016.
Gauteng
Gauteng has the highest taxes and levies and it is understandable because the province is the most populous in South Africa. 2012 had up to R836 million in taxes and levies which amounted to 9.2% of the GGR. In 2013, we saw a 1.4% increase to R848 million which amounted to 9.5% of the GGR.
The percentage of GGR had a slight drop to 9.3% in 2014 but we still saw a 6.3% increase in the numbers, increasing to R901 million. 2015 and 2016 amounted to R913 and R1 005 million respectively as we saw the percentages of GGR giving 8.6% and 9.1%.
KwaZulu-Natal
Although KwaZulu-Natal gave lower numbers in currency, the percentage increase for each year was higher than that of Gauteng. 2012 started with R494 million before giving an 8.3% increase to R535 million while the percentage on GGR equally rose from 12.5% to 12.9%. From 2014 to 2016, we had a progressive rise from 560, 612, and 624 (R millions). The GGR, on the other hand, had a steady fluctuation between 12.8, 12.6, and 12.5 each year.
Western Cape
This region was not far behind KwaZulu-Natal in the numbers game. 2012 had R402 million in taxes and levies before giving a 14.2% rise to R459 million while having a higher 13.4% impact on the GGR. The next year saw another record increase of 17.4% to R539 million while impacting the GGR a little higher at 14.5%. 2015 and 2016 saw further growth in taxes and levies with R574 and R581 million respectively. Thanks to market giants such as Betway, SupaBets, WSB etc.
Eastern Cape
Eastern Cape has relatively lower numbers compared to the Western region with R112 million in 2012, impacting the GGR with 7.9%. 2013 to 2016 had 112, 122, 139, 158, and 171 (R millions) respectively. The impact on GGR never had a significant increase as it frequented 8.0%, 8.1%, 8.3%, and 8.2% within the years.
North West
North West started with R86 million in 2012 before increasing progressively to 96, 102, 136 (R million) and a final 15.4% drop to R115 million in 2016. The impact on GGR in percentages from 2012 to 2016 were 7.8%, 8.1%, 8.1%, 8.4%, and 7.7% respectively.
Mpumalanga
Mpumalanga started at R67 million in 2012 before having a steady increase to 74, 83, 87, and 91 (R million) respectively from 2013 to 2016. The GGR impact from 2012 to 2016 were 7.6%, 7.7%, 7.8%, 7.6%, and 7.6% respectively.
Limpopo
For Limpopo, we saw 2012 start with R46 million while rising to 48, 56, 70, and 78 (R million) through the years. The respective percentages of GGR were 7.9%, 7.6, 7.9%, 7.7%, and 8.2% respectively.
Free State
Free State has not had significant increases in the years of study. Starting from R40 million in 2012, the next year saw a 0% increase while 2014 had a 2.5% drop to R39 million before showcasing a 12.8% growth to R44 million in 2015. Just like 2013, 2016 also had a 0% growth.
Northern Cape
Unsurprisingly, Northern Cape has the lowest gambling taxes and levies. 2012 saw R16 million while giving a 6.3% drop to R15 million in the next year. Succeeding years yielded 18, 21, and 23 (R millions) respectively.
Wrap Up
No matter how the situation may look, numbers tell the true story. And from this overview, it is glaring that gambling is growing in several sectors in South Africa. However, the losses that come from illegal gambling establishments are concerning. On the bright side, the government is taking measures and when it is successful, we will see even better figures.

